Design the members first
The fibre sections are built from the bars the design placed in each RC beam line and column stack. Members without designed bars stay elastic. So solve the static study and run Design… before the pushover.
In the sample, Results › Seismic › Seismic assessment does both for you (see the first tutorial).
If a member already yields under gravity alone, the program warns you: its reinforcement is too weak.
Set up the pushover study
Select Pushover X triangular in the Explorer. Its Pushover group in Properties holds the main settings:
| Property | What it does |
|---|---|
| Direction | X or Y. |
| Lateral pattern | Triangular (∝ weight × height) or Uniform (∝ weight). |
| Loading | Monotonic, or Cyclic for hysteresis loops. |
| Target roof drift (%) | Roof displacement over building height at which the push stops. |
| Steps | Number of push steps. Fewer steps run faster. |
| Check member shear | Compares end shears with the ACI capacity Vc + Vs. |
| Stop at shear failure | Ends the push at the first member that fails in shear. |
| Rigid joint zone | Part of each joint that is rigid, so hinges form near the faces. Default 0.25. |
| Bar slip at the member ends | Adds the fixed-end rotation of bars slipping in the joint. Converges less reliably. |
The Section model sets how members yield: fibre sections along the member (the default), fibre hinges at the member ends, or lumped IMK hinges. See Section models.
How the load is applied
- Gravity first. The loads of the study’s combination are applied in 10 steps and held. A new study takes dead loads in full and a quarter of the live loads.
- Then the push. The lateral pattern is applied under displacement control at the highest node nearest the centre of the plan.
- The push ends at the target drift, when strength drops to 80 % of the peak, at a shear failure, or when the analysis stops converging. Each step that fails is retried with other solution algorithms and smaller sub-steps first.
Run the pushover
With the study selected, press F5, or choose Analysis › Pushover. That item runs the first pushover study, and adds one if the project has none.
Read the capacity curve
Choose Results › OpenSees › Seismic charts › Pushover curve. It plots base shear against roof displacement or drift, with the equal-energy bilinear idealisation and the ductility.
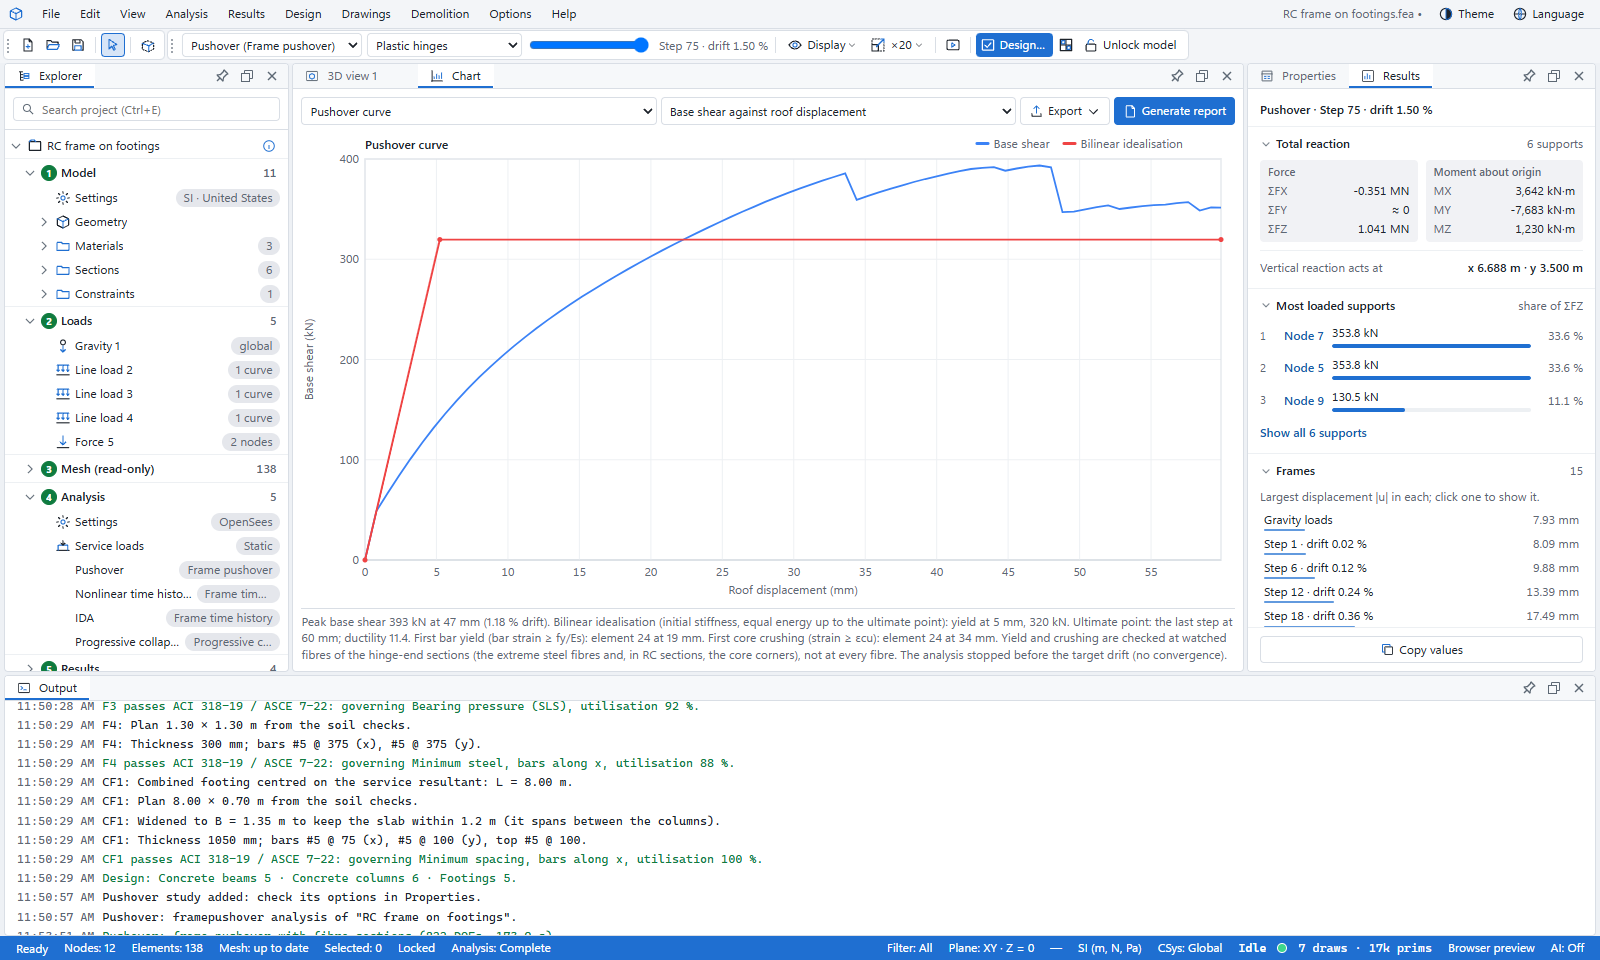
Every chart of the study is also under Explorer › Results › Seismic results.
Find the performance point
Choose Results › Seismic › Performance point. The program turns the curve into an equivalent single-degree system and works out the target displacement two ways:
- the coefficient method of ASCE 41-17 or FEMA 356 (study property Target displacement),
- the N2 method of EN 1998-1 Annex B.
The demand is the design spectrum of the study’s Seismic hazard group. The Capacity spectrum (ADRS) chart shows both targets. The Output panel lists the hinges within IO, LS and CP at each target.
ASCE 41-17 asks the push to reach 150 % of the target displacement. If it does not, the program warns you. Raise the target roof drift, or the steps, and run it again.
Check the hinges
Choose Results › Seismic › Hinge acceptance. Each hinge’s plastic rotation is compared with the ASCE 41-17 limits for immediate occupancy (IO), life safety (LS) and collapse prevention (CP):
- RC beams: Table 10-7. RC columns: Table 10-8, and Table 10-9 for circular columns.
- Steel beams and columns: Table 9-7.1.
- RC wall piers: Table 10-19.
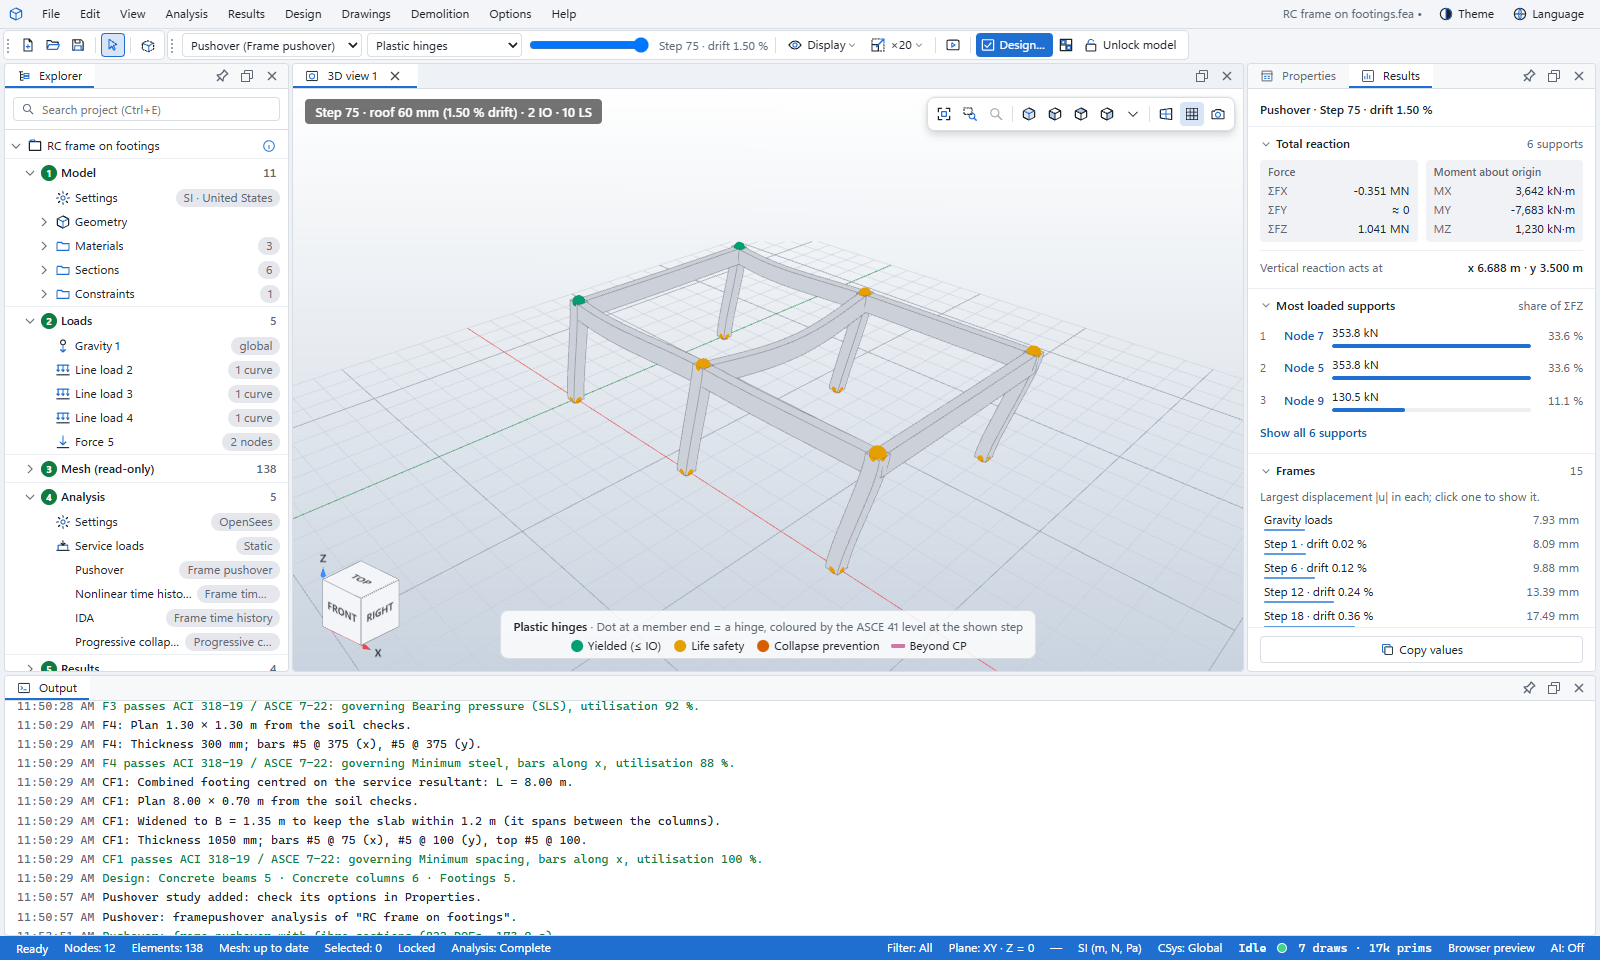
The charts Hinge acceptance (ASCE 41) and Joint shear (ASCE 41) show the results. To see the hinges on the model, open Explorer › Results › Seismic results › Plastic hinges in 3D and move the step slider. The hinges are coloured by level.
Strengthen, or cycle the push
Results › Seismic › Strengthen from pushover… strengthens the members beyond a level one step at a time (ties, then bars, then a larger section) and runs the study again until it passes. It is one undo step.
Analysis › Cyclic runs reversed cycles of rising drift instead of one push. The default amplitudes are 0.25, 0.5, 1, 1.5 and 2 % with 2 cycles each. The chart shows the hysteresis loops and the energy they dissipate.
What you learned
- The pushover reads the designed bars, so design comes first.
- Gravity is applied and held, then the building is pushed to the target drift.
- The performance point comes from the coefficient method or N2, and the hinges are checked against ASCE 41-17 IO, LS and CP.